RESIDENTIAL SURCHARGE DASHBOARD
Quantifying Delivery Cost Impacts with Unit-Based Surcharge Analysis
Portfolio Disclaimer
This project showcase contains fictional data, metrics, and business scenarios created for portfolio demonstration purposes. While the technical implementation and methodologies are real, specific numbers, company details, and outcomes may not reflect actual business results.
Purpose
A comprehensive Power BI dashboard designed to provide stakeholders with clear visibility into surcharge opportunities for residential deliveries, enabling data-driven decision making and revenue optimization.
This project demonstrates advanced DAX calculations, interactive filtering, and geographic visualization to transform complex freight data into actionable business insights.
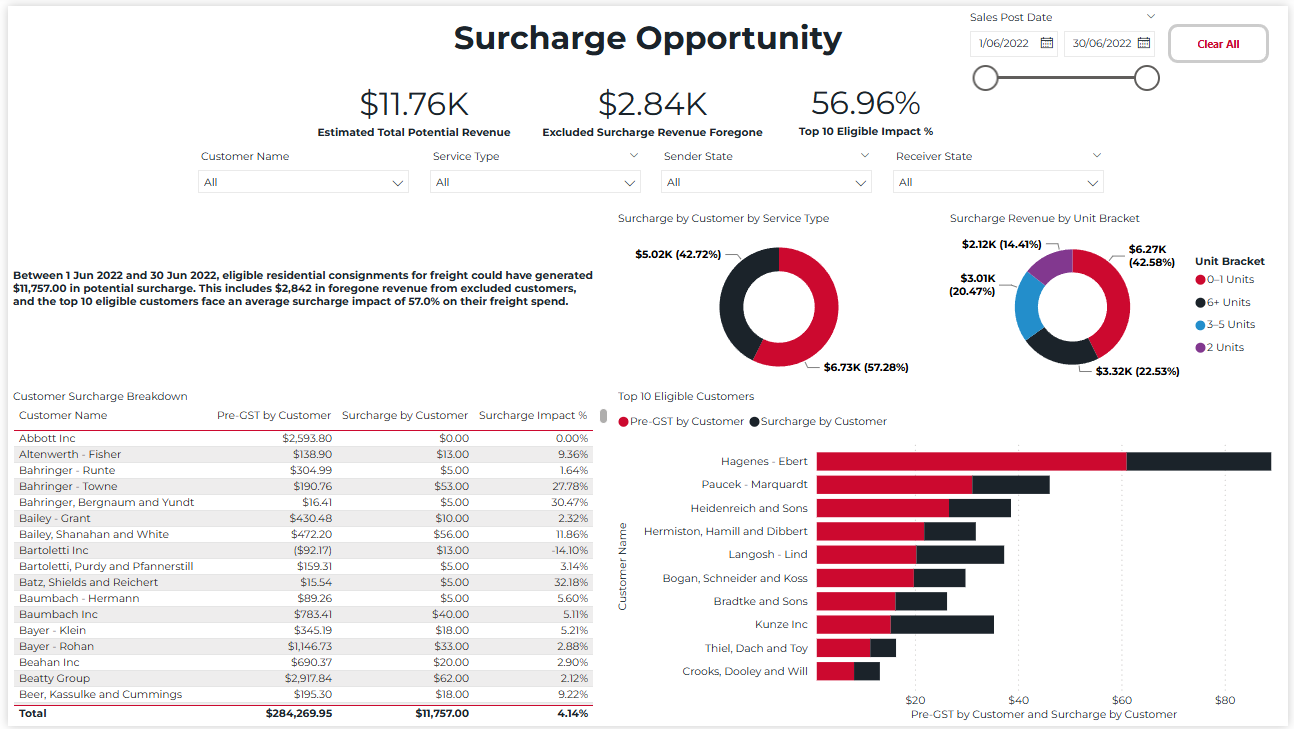
This dashboard is intended to provide a comprehensive view of the estimated surcharge opportunity for deliveries made to residential addresses based on unit volume.
Dashboard Views
Documentation & Definitions
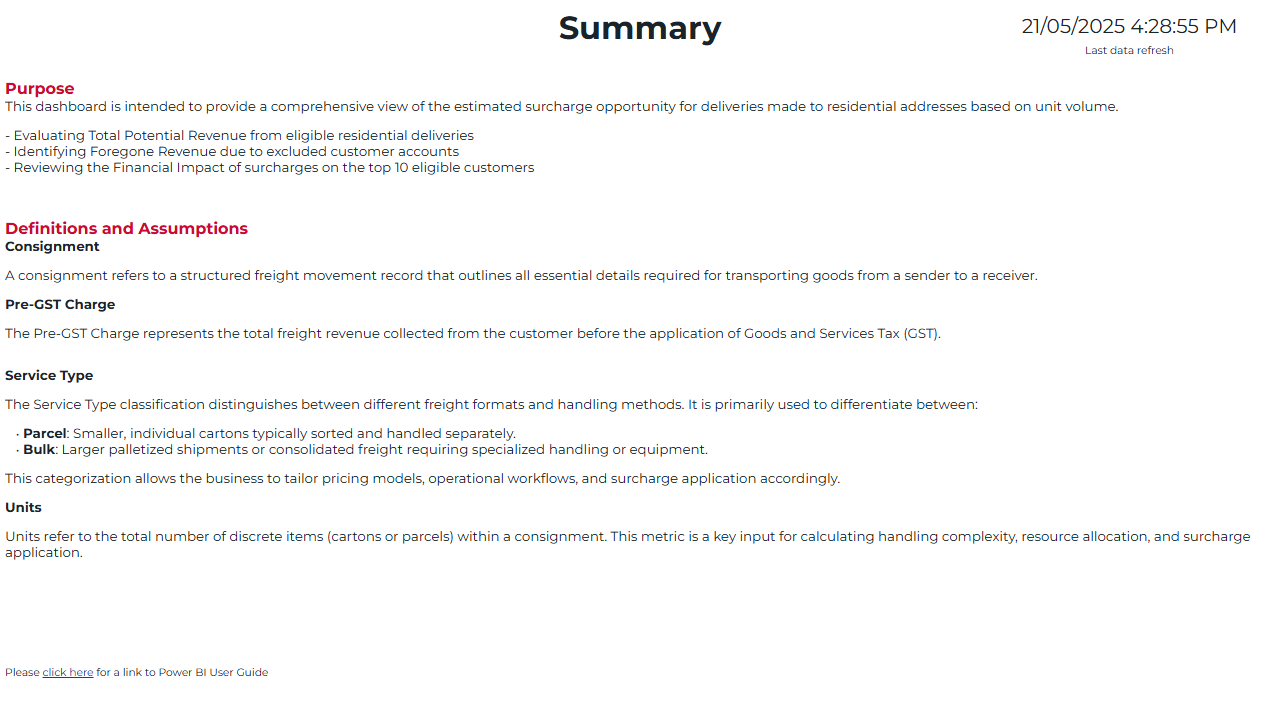
The summary page provides essential context and definitions to ensure consistent understanding across all stakeholders. Key components include:
- Clear purpose statement outlining the dashboard objectives and intended use cases
- Comprehensive definitions of key terms including Consignment, Pre-GST Charge, Service Type, and Units
- Detailed explanation of the Parcel vs. Bulk service type classification
- Business context for how these definitions impact pricing models and operational workflows
- Link to the full Power BI user guide for additional training and reference
Surcharge Opportunity Overview
The primary dashboard view provides a comprehensive analysis of surcharge opportunities across the business. Key components include:
- Three primary KPIs showing total potential revenue, excluded revenue, and top 10 customer impact
- Interactive filters for customer name, service type, sender/receiver state, and date range
- Donut charts visualizing surcharge distribution by service type and unit bracket
- Detailed customer breakdown table with sortable columns for granular analysis
- Horizontal bar chart highlighting the top 10 eligible customers with stacked pre-GST and surcharge values
Regional Breakdown Analysis
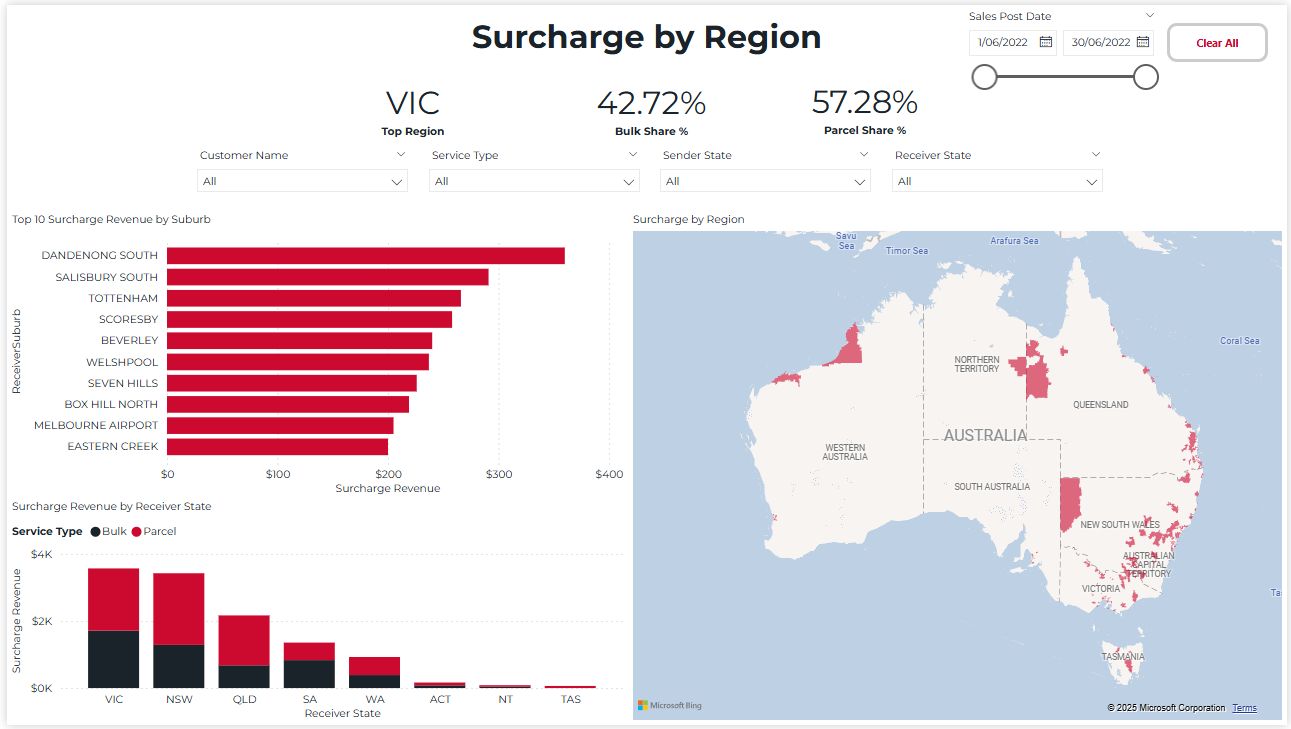
The regional analysis page provides geographic insights into surcharge distribution across Australia, enabling targeted regional strategies. Key features include:
- Top region identification (VIC) with bulk (42.72%) and parcel (57.28%) share percentages
- Horizontal bar chart showing top 10 suburbs by surcharge revenue
- Interactive map visualization highlighting residential surcharge density across Australia
- Stacked bar chart breaking down surcharge revenue by receiver state and service type
- Consistent filter panel allowing for seamless cross-page analysis
Technical Implementation
Data Architecture
- •Data Sources: SQL Server database containing freight consignment records, customer master data, and geographic information
- •ETL Process: Power Query used to transform raw data, including address normalization, service type classification, and unit aggregation
- •Data Model: Star schema with fact tables for consignments and dimension tables for customers, locations, and time periods
- •Refresh Schedule: Automated daily refresh with incremental loading to minimize processing time
DAX Implementation
Advanced DAX measures were developed to calculate surcharge opportunities.
// Calculate potential surcharge revenue
Potential Surcharge =
SUMX(
  Consignments,
  IF(
      Consignments[ServiceType] = "Parcel",
      Consignments[Units] * 0.50,
      Consignments[Units] * 0.75
  )
)
Visualization Techniques
- •Custom Color Palette: Designed a consistent color scheme with red highlights for surcharge values and dark gray for pre-GST amounts
- •Conditional Formatting: Applied to tables and charts to highlight values exceeding thresholds or requiring attention
- •Custom Tooltips: Enhanced with additional context and metrics not visible in the main visualization
- •Geographic Mapping: Used Bing Maps integration with custom region highlighting based on surcharge density
User Experience Design
- •Stakeholder Interviews: Conducted with 5 key business users to understand reporting needs and pain points
- •Iterative Design: Three prototype versions tested with users before finalizing the dashboard layout
- •Accessibility: Implemented colorblind-friendly palette and screen reader compatibility
- •Mobile Optimization: Responsive design elements for tablet viewing during executive meetings
- •User Documentation: Created comprehensive guide with video tutorials for new users
Technical Challenges & Solutions
Challenges
- •Large data volume (10M+ consignment records) causing performance issues
- •Inconsistent address formatting making residential classification difficult
- •Complex business rules for surcharge eligibility across customer segments
- •Multiple stakeholders with different analytical requirements
Solutions
- •Implemented aggregation tables and query folding to improve performance
- •Created address normalization algorithm with fuzzy matching
- •Developed parameter tables to allow business users to adjust rules
- •Created personalized views with role-based security
Business Value & Revenue Generation
This dashboard transformed how the business approaches residential delivery pricing, providing clear visibility into revenue opportunities and enabling strategic decision-making that directly impacted the bottom line.
Revenue Identification
Identified previously untapped revenue potential from residential surcharges, providing a clear roadmap for pricing optimization.
Efficiency Gains
Reduction in manual reporting time, allowing analysts to focus on strategic initiatives rather than data compilation.
Strategic Insights
Customer impact analysis enabled targeted negotiations and pricing strategies for high-value accounts.
Immediate Business Impact
- ✓Enabled implementation of residential surcharge policy within 30 days
- ✓Provided data-driven justification for pricing changes to stakeholders
- ✓Identified $2.84K in revenue leakage from excluded accounts
- ✓Created framework for ongoing surcharge optimization
Long-term Strategic Value
- →Established data-driven pricing methodology for future services
- →Enhanced stakeholder confidence in analytical capabilities
- →Created reusable dashboard template for other business units
- →Improved customer segmentation and targeting strategies
Interested in Similar Analysis?
This project demonstrates my ability to transform complex business requirements into powerful, interactive dashboards that drive decision-making and revenue optimization.