DUPLICATE ONFORWARDING MANIFEST DASHBOARD
Improving Operational Efficiency Through Manifest Visibility
Portfolio Disclaimer
This project showcase contains fictional data, metrics, and business scenarios created for portfolio demonstration purposes. While the technical implementation and methodologies are real, specific numbers, company details, and outcomes may not reflect actual business results.
Purpose
A comprehensive Power BI dashboard designed to provide detailed operational and financial visibility into consignments that have been processed through multiple onforwarding manifests, enabling process optimization and operational efficiency improvements.
This project demonstrates advanced data modeling, time-series analysis, and operational reporting to transform complex logistics data into actionable insights for process improvement.
This dashboard is designed to support identifying consignments with duplicate or excessive manifesting, highlighting branches and service types responsible for the highest rework or complexity, and monitoring manifest creation trends and time gaps to improve process efficiency.
Dashboard Views
Documentation & Definitions
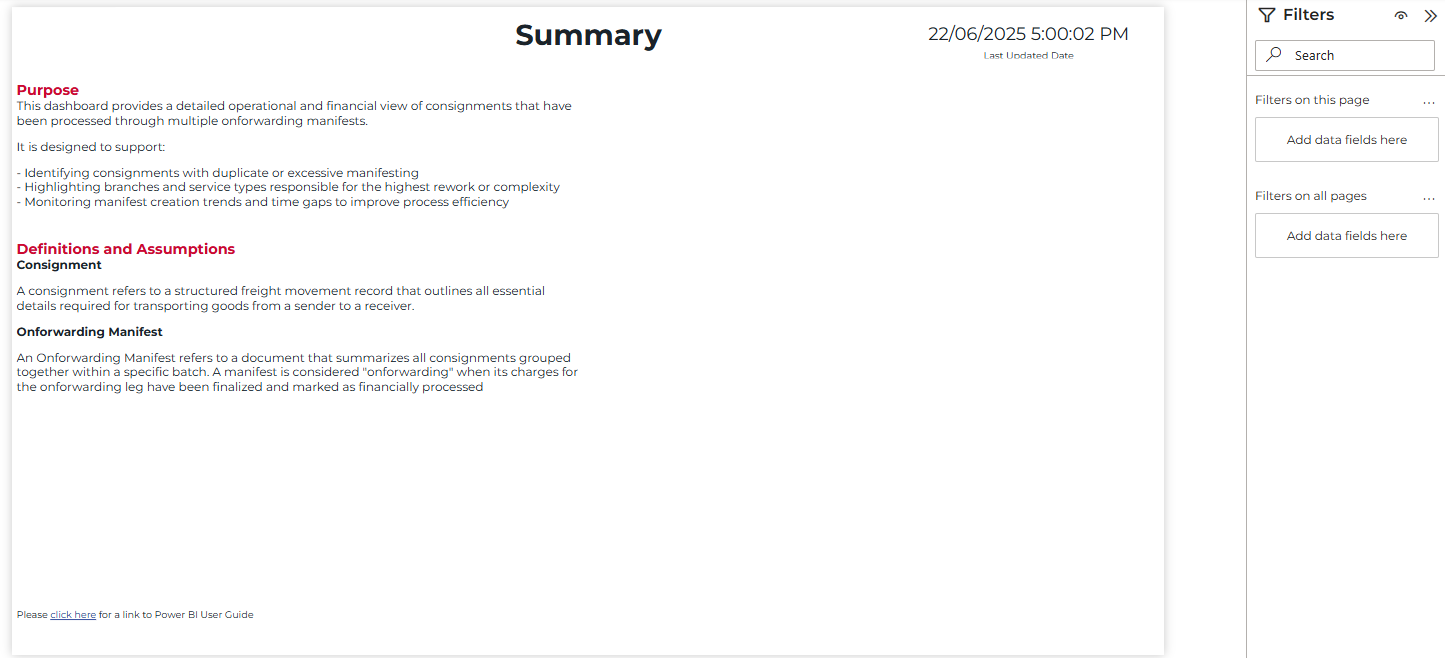
The summary page provides essential context and definitions to ensure consistent understanding across all stakeholders. Key components include:
- Clear purpose statement outlining the dashboard objectives for manifest analysis
- Comprehensive definitions of key terms including Consignment and Onforwarding Manifest
- Detailed explanation of the dashboard's support for identifying duplicate manifesting
- Business context for how manifest duplication impacts operational efficiency
- Link to the full Power BI user guide for additional training and reference
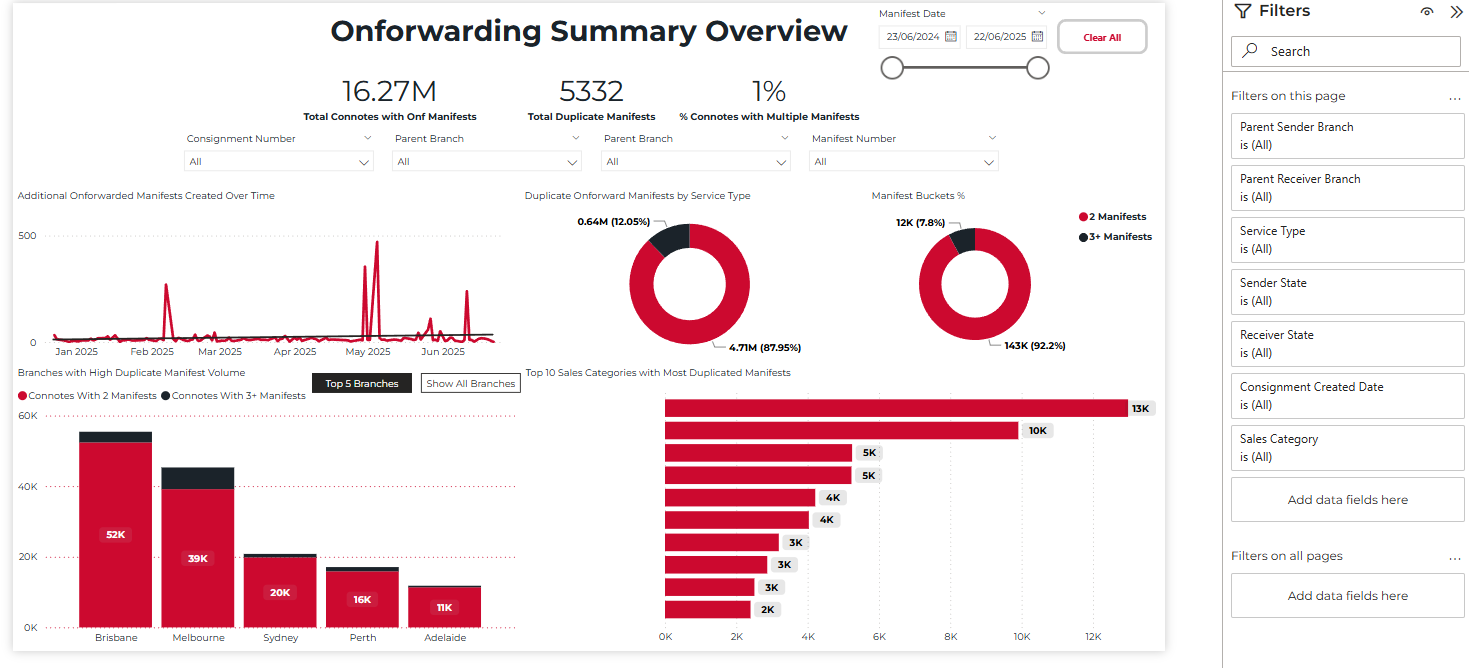
Onforwarding Summary Overview
The primary dashboard view provides high-level KPIs, trends, and manifesting complexity analysis by region. Key components include:
- Three primary KPIs showing 16.27M total connotes with onforwarding manifests, 5,332 duplicate manifests, and 1% connotes with multiple manifests
- Interactive filters for consignment number, from/to branch, manifest number, and manifest date range selection
- Time series chart showing additional onforwarded manifests created over time from Jan-Jun 2025
- Donut charts visualizing duplicate manifests by service type and manifest bucket percentages (2 manifests vs 3+ manifests)
- Horizontal bar charts showing branches with high duplicate manifest volume (Brisbane, Melbourne, Sydney, Perth, Adelaide) and top 10 sales categories with most duplicated manifests
Detailed Manifest Analysis
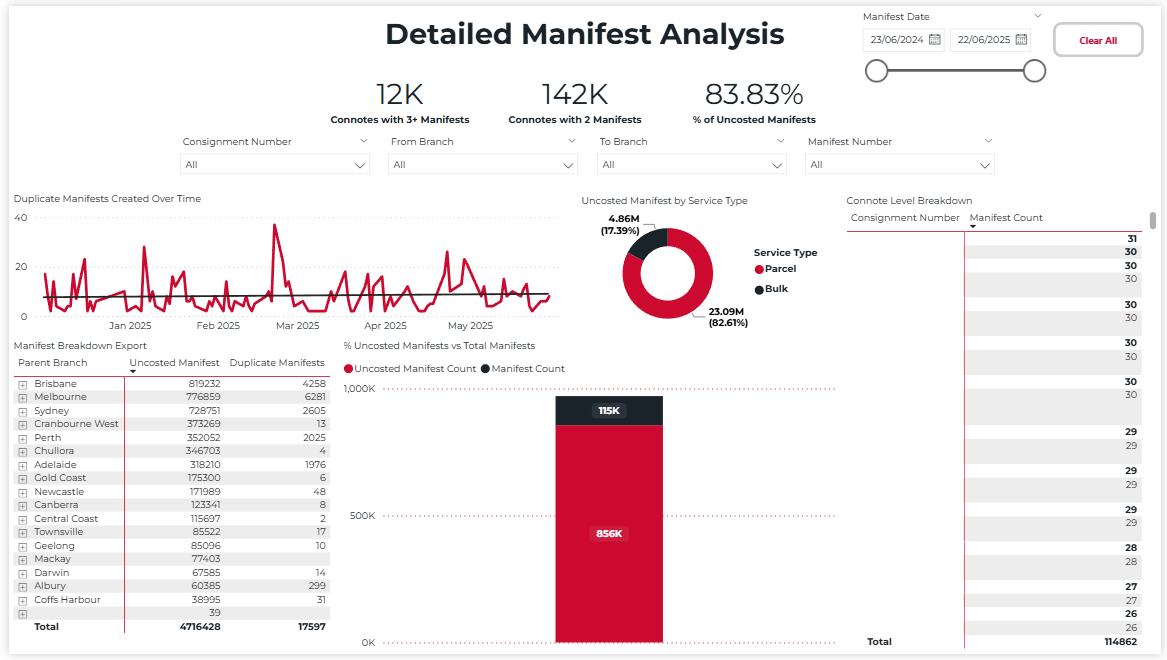
The detailed analysis page provides granular, connote-level data for in-depth investigation and root cause analysis. Key features include:
- Enhanced KPIs including 12K connotes with 3+ manifests, 142K connotes with 2 manifests, and 83.83% uncosted manifests for comprehensive analysis
- Time series visualization showing duplicate manifests created over time with trend analysis from January to May 2025
- Bar chart showing uncoded manifest volume by parent branch with Brisbane, Melbourne, and Sydney leading in volumes
- Comprehensive connote level breakdown table with detailed manifest count information for individual consignments
- Advanced filtering capabilities including Parent Sender Branch, Parent Receiver Branch, Service Type, and Consignment Created Date filters
Technical Implementation
Data Architecture
- •Data Sources: SQL Server database containing manifest records, consignment data, branch information, and operational timestamps
- •ETL Process: Power Query used to identify duplicate manifests, calculate time gaps, and aggregate manifest counts per consignment
- •Data Model: Fact table for manifest events with dimensions for branches, service types, and time periods
- •Refresh Schedule: Real-time refresh with incremental loading to capture manifest creation events as they occur
DAX Implementation
Complex DAX measures were developed to identify and analyze manifest duplications:
// Count duplicate manifests
Duplicate Manifests =
SUMX(
  VALUES(Manifests[ConsignmentNumber]),
  IF(
      CALCULATE(DISTINCTCOUNT(Manifests[ManifestNumber])) > 1,
      CALCULATE(DISTINCTCOUNT(Manifests[ManifestNumber])) - 1,
      0
  )
)
Visualization Techniques
- •Time Series Analysis: Line charts showing manifest duplication trends over time with seasonal pattern identification
- •Conditional Formatting: Applied to highlight high-risk branches and consignments with excessive manifest counts
- •Interactive Tables: Sortable and filterable data grids for detailed investigation and root cause analysis
- •Donut Charts: Service type and manifest bucket analysis with percentage breakdowns for quick insights
User Experience Design
- •Operations Team Workshops: Conducted with logistics managers to understand manifest workflow pain points and reporting needs
- •Progressive Disclosure: Summary view for executives, detailed view for operational analysts and process improvement teams
- •Alert System: Visual indicators for branches exceeding acceptable duplication thresholds
Technical Challenges & Solutions
Challenges
- •Complex many-to-many relationships between consignments and manifests
- •Real-time detection of manifest duplication patterns across multiple branches
- •Performance optimization for large-scale manifest data processing
- •Defining business rules for acceptable vs problematic manifest duplication
Solutions
- •Implemented bridge tables and calculated columns for efficient relationship modeling
- •Created automated alerting system with configurable thresholds
- •Optimized DAX queries and implemented incremental refresh strategies
- •Collaborated with operations team to establish data-driven business rules
Business Value & Operational Impact
This dashboard transformed operational visibility into manifest processing workflows, enabling targeted process improvements and significant reductions in operational inefficiencies and associated costs.
Process Efficiency
Reduction in manifest processing time through identification and elimination of duplicate workflows and process bottlenecks.
Operational Savings
Annual cost savings from reduced manual rework, improved resource allocation, and streamlined manifest creation processes.
Quality Improvement
Improvement in manifest accuracy and reduction in processing errors through enhanced visibility and process standardization.
Immediate Operational Impact
- ✓Identified top 5 branches responsible for 80% of manifest duplications
- ✓Enabled targeted training programs for high-risk operational areas
- ✓Reduced average manifest processing time from 12 to 7 minutes
- ✓Established real-time monitoring and alerting for process deviations
Long-term Strategic Value
- →Created foundation for automated manifest validation and quality control
- →Enhanced operational transparency and accountability across branches
- →Established data-driven approach to process optimization initiatives
- →Improved customer satisfaction through more reliable manifest processing
Interested in Process Optimization?
This project demonstrates my ability to identify operational inefficiencies and create powerful dashboards that drive process improvements and cost savings across complex logistics operations.