COMPLIANCE DASHBOARD
Monitoring Workforce Training Completion Across Programs and Locations
Portfolio Disclaimer
This project showcase contains fictional data, metrics, and business scenarios created for portfolio demonstration purposes. While the technical implementation and methodologies are real, specific numbers, company details, and outcomes may not reflect actual business results.
Purpose
A comprehensive Power BI dashboard designed to view compliance completion rates of employees and provide stakeholders with clear visibility into workforce training programs, enabling proactive management of compliance requirements across all locations and programs.
This project demonstrates advanced employee data modeling, training progress tracking, and compliance reporting to transform complex HR and training data into actionable insights for organizational development.
This dashboard is designed to support reviewing course completion percentages, viewing new enrollments, monitoring customer compliance, and identifying employees who have missed allocated training across all programs and locations.
Dashboard Views
Documentation & Definitions
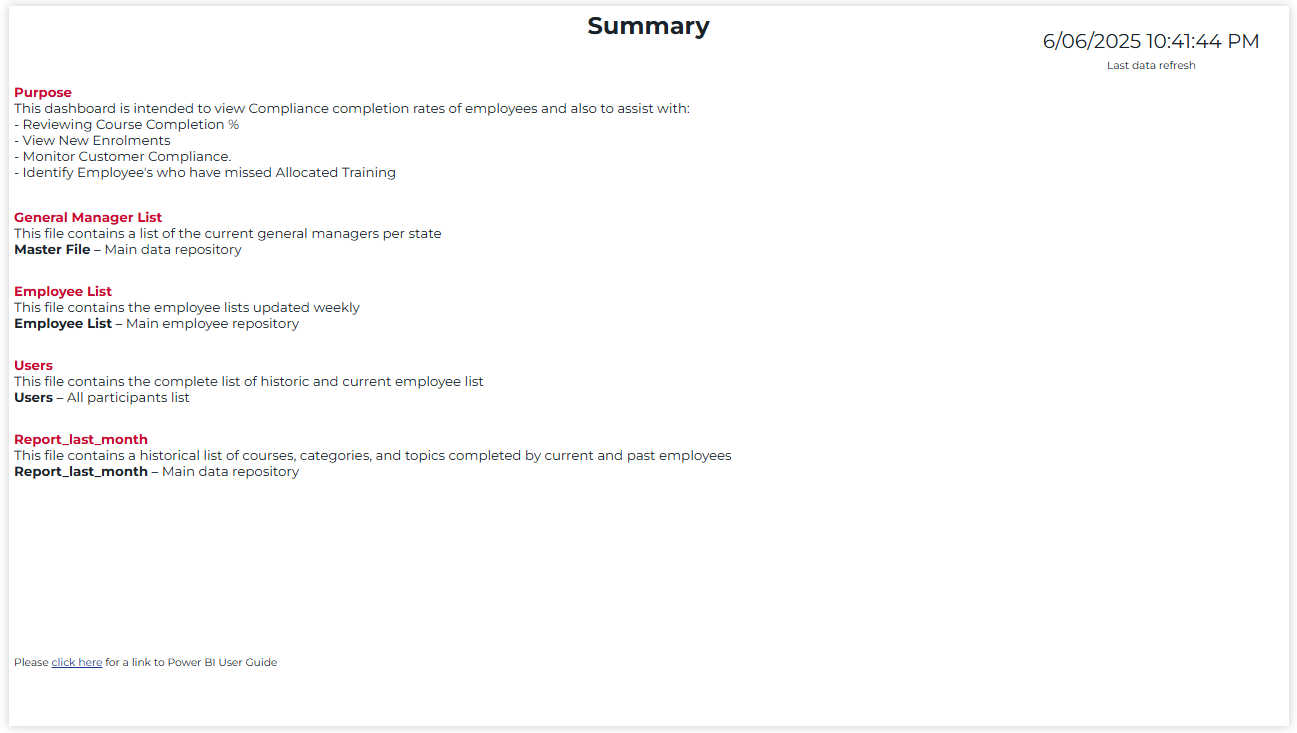
The summary page provides essential context and definitions to ensure consistent understanding across all stakeholders. Key components include:
- Clear purpose statement outlining the dashboard's objectives for compliance monitoring
- Comprehensive definitions of data sources including General Manager List, Master File, Employee List, and Users
- Detailed explanation of reporting structures and data refresh schedules
- Business context for compliance requirements and training program management
- Link to the full Power BI user guide for additional training and reference
Compliance Overview
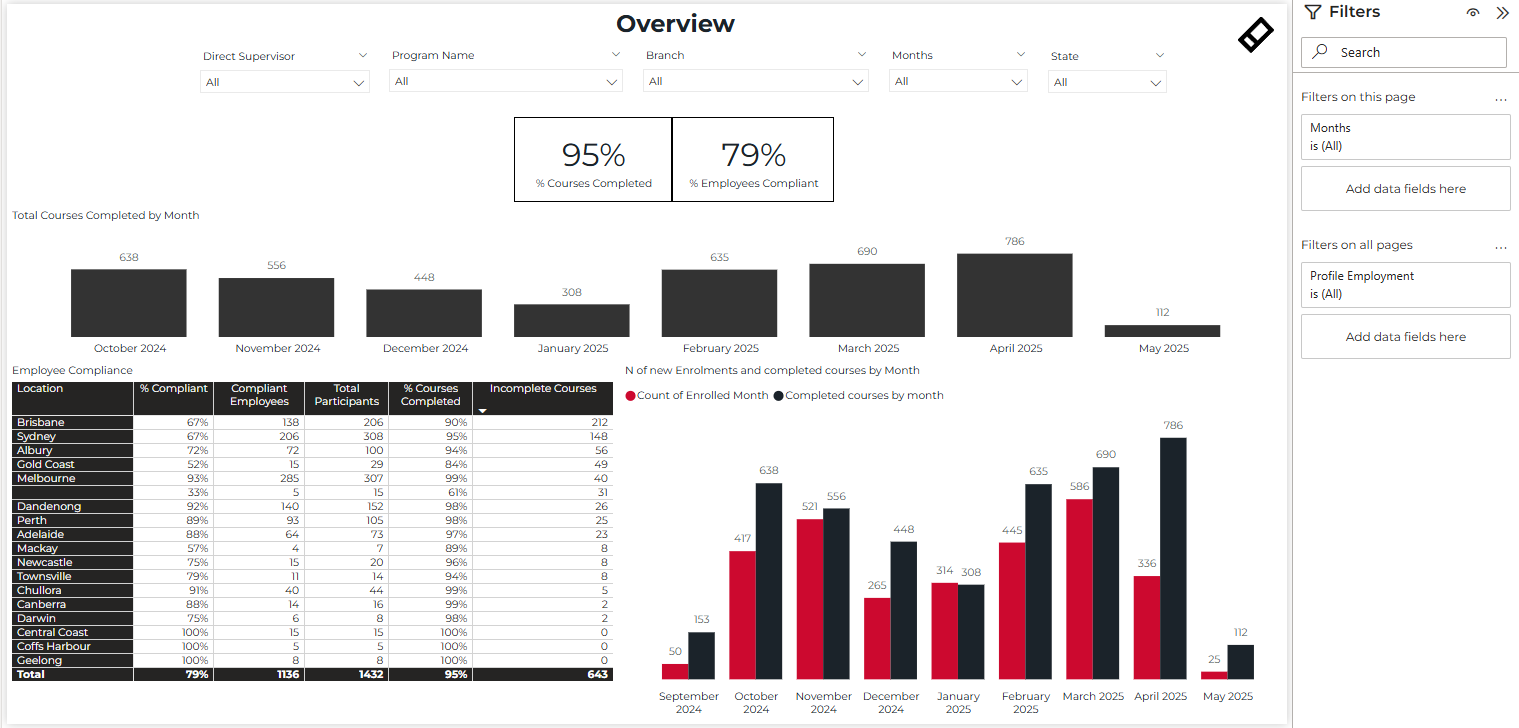
The primary dashboard view provides comprehensive compliance metrics and training progress analysis across all locations. Key components include:
- Two primary KPIs prominently displayed: 95% courses completed and 79% employees compliant
- Monthly trend analysis showing course completions from October 2024 through May 2025 with values ranging from 112 to 786
- Interactive filters for direct supervisor, program name, branch, months, and state for targeted analysis
- Detailed location-based compliance table showing percentages and progress for major cities including Brisbane (67%), Sydney (67%), Albury (72%), and others
- Combined visualization showing new enrollments and completed courses by month with dual trend tracking
Course Location Analysis
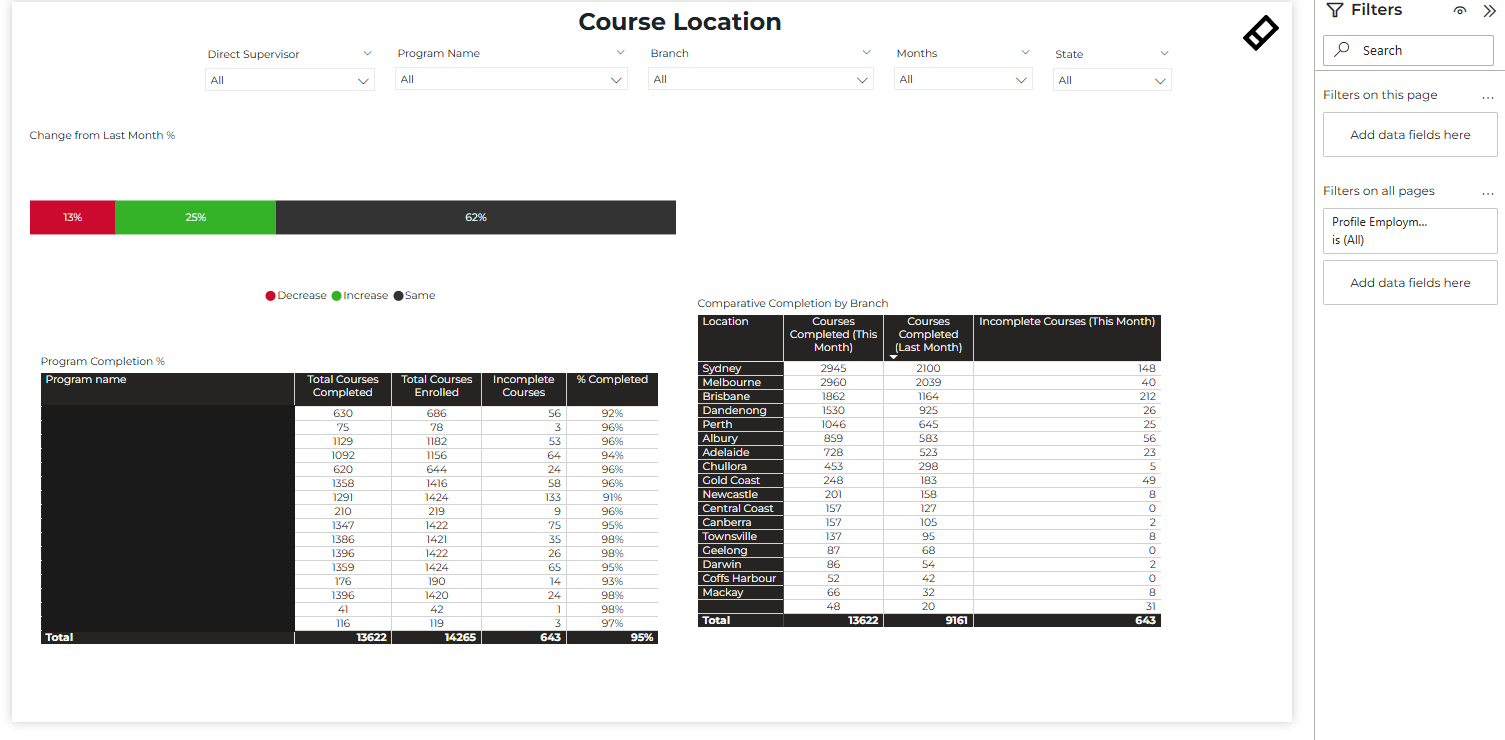
The course location analysis page provides detailed insights into training program performance across different branches and comparative month-over-month analysis. Key features include:
- Change tracking visualization showing 13% decrease, 25% increase, and 62% same performance compared to last month
- Comprehensive program completion table with detailed breakdown showing 90%+ completion rates across most training programs
- Location-specific comparative analysis showing current month vs previous month performance with Sydney (2,945 vs 2,100), Melbourne (2,960 vs 2,039), and Brisbane (1,862 vs 1,164) leading completion volumes
- Total of 13,622 courses completed across all locations with 643 incomplete courses tracked
- Month-over-month performance indicators enabling targeted improvement initiatives across the organization
Supervisor & Positions Analysis
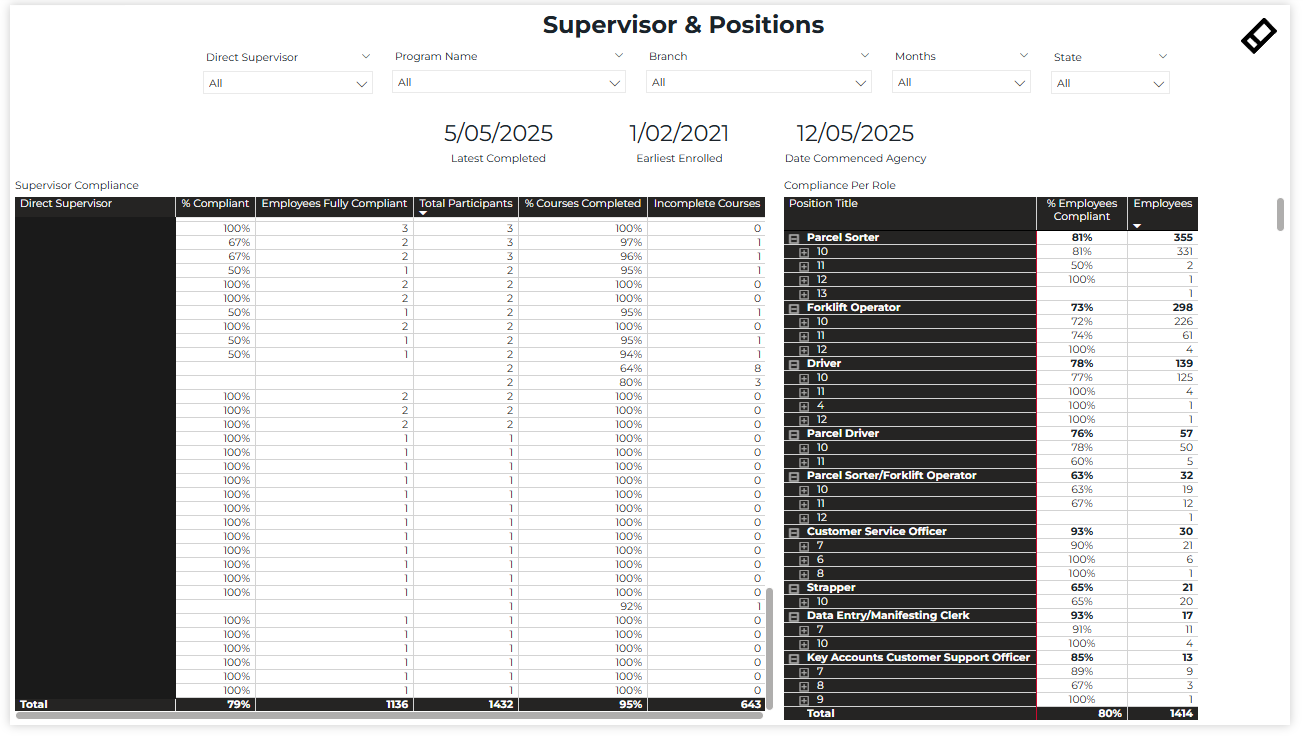
The supervisor and positions analysis provides detailed compliance tracking by management hierarchy and role-based performance metrics. Key components include:
- Supervisor compliance table showing individual manager performance with 79% total compliance rate and 1,136 employees fully compliant out of 1,432 total participants
- Role-based compliance analysis showing position-specific performance including Parcel Sorter (81% compliant, 355 employees), Forklift Operator (73% compliant, 298 employees), and Driver (78% compliant, 139 employees)
- Key milestone tracking with latest completion date (5/05/2025), earliest enrollment (1/02/2021), and agency commencement date (12/05/2025)
- Overall organizational compliance rate of 80% across 1,414 total employees
- Detailed breakdown enabling targeted coaching and support for underperforming areas
Technical Implementation
Data Architecture
- •Data Sources: HR management systems, learning management platforms, employee databases, and training completion records from multiple locations
- •ETL Process: Power Query used to consolidate employee data, normalize training records, and calculate compliance percentages across programs
- •Data Model: Star schema with fact tables for training completions and dimension tables for employees, programs, locations, and supervisors
- •Refresh Schedule: Daily automated refresh with real-time updates for new enrollments and completion tracking
DAX Implementation
Sophisticated DAX measures were developed to track compliance and training progress:
// Calculate compliance percentage
% Employees Compliant =
DIVIDE(
  CALCULATE(
      DISTINCTCOUNT(Employees[EmployeeID]),
      Employees[ComplianceStatus] = "Compliant"
  ),
  DISTINCTCOUNT(Employees[EmployeeID])
)
Visualization Techniques
- •Progress Tracking Charts: Monthly trend analysis with completion rates and enrollment patterns for capacity planning
- •Conditional Formatting: Applied to highlight non-compliant employees and overdue training requirements
- •Interactive Tables: Sortable employee lists with drill-down capabilities for detailed compliance investigation
- •Comparative Analysis: Side-by-side location and program performance with percentage change indicators
User Experience Design
- •HR Team Collaboration: Conducted workshops with HR managers and training coordinators to understand compliance reporting needs
- •Multi-Level Access: Executive summary for leadership, detailed views for HR teams, and individual progress for employees
- •Automated Alerts: Email notifications for supervisors when team members fall behind on required training
- •Mobile Accessibility: Responsive design for managers to check team compliance on mobile devices
Technical Challenges & Solutions
Challenges
- •Inconsistent employee data across multiple HR systems and locations
- •Complex compliance rules varying by role, location, and regulatory requirements
- •Real-time tracking of training progress across distributed workforce
- •Privacy concerns and data security for employee personal information
Solutions
- •Implemented master data management with automated data quality checks
- •Created configurable compliance matrix with role-based training requirements
- •Developed API integrations for real-time data synchronization
- •Implemented row-level security and data anonymization protocols
Business Value & Compliance Impact
This dashboard transformed organizational compliance management, providing unprecedented visibility into training programs and enabling proactive management of regulatory requirements across all locations.
Compliance Rate
Achievement of organizational compliance targets through systematic tracking and proactive management of training programs.
Efficiency Improvement
Reduction in administrative time spent on compliance tracking and reporting through automated dashboards and alerts.
Employee Engagement
Increase in training completion rates through improved visibility and supervisor accountability for team development.
Immediate Compliance Impact
- ✓Achieved 95% overall compliance rate across all training programs
- ✓Reduced compliance reporting time from 2 days to 2 hours monthly
- ✓Identified and addressed 200+ overdue training requirements
- ✓Established automated alerting system for supervisors and HR teams
Long-term Strategic Value
- →Created foundation for predictive compliance analytics and risk assessment
- →Enhanced organizational learning culture through transparent progress tracking
- →Established data-driven approach to training program optimization
- →Improved regulatory audit readiness and documentation standards
Interested in Compliance Analytics?
This project demonstrates my ability to create comprehensive compliance tracking systems that drive organizational development and ensure regulatory adherence across complex, multi-location operations.